
Net new assets are behind last year on both a year-to-date and monthly basis. The $2.89 Bn gathered during May 2018 was 77.2% less than the $12.7 Bn in net inflows during this month last year. Similarly, year-to-date net inflows for 2018 reached US$27.4 Bn at the end of May, which is less than the US$35.4 Bn in net inflows at this point last year.
According to ETFGI’s May 2018 European ETF and ETP industry insights report, an annual paid-for research subscription service, assets invested in ETFs/ETPs listed in Europe decreased by $10.5 Bn during May 2018. At the end of May 2018, the European ETF/ETP industry had 2,324 ETFs/ETPs, with 7,684 listings, assets of $819.7 Bn, from 66 providers on 27 exchanges.
Equity ETFs/ETPs gathered the largest net inflows of $2.07 Bn during May, bringing net new assets for 2018 to $23.7 Bn, which is lower than the $32.6 Bn in net inflows at this point last year. Fixed income products experienced their largest net outflows of the year with $714 Mn during May, bringing net inflows for 2018 to $4.20 Bn, which is also less than the $12.4 Bn in net inflows at this point last year.
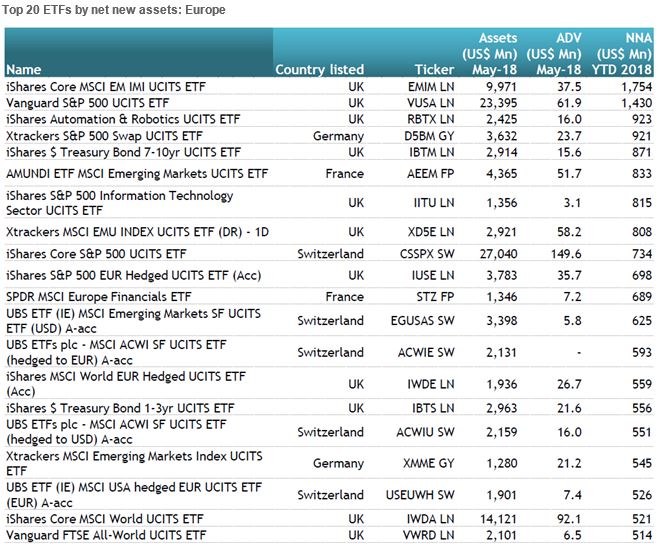
The majority of net inflows can be attributed to the top 20 ETFs by net new assets, which collectively gathered $15.5 Bn during 2018. The iShares Core MSCI EM IMI UCITS ETF (EMIM LN) on its own accounted for net inflows of $1.75 Bn. Notably, the top three ETFs/ETPs by net inflows year-to-date end had equity exposure outside Europe.

- Source: ETFGI data sourced from ETF/ETP sponsors, exchanges, regulatory filings, Thomson Reuters/Lipper, Bloomberg, publicly available sources and data generated in-house.Note: This report is based on the most recent data available at the time of publication. Asset and flow data may change slightly as additional data becomes available.
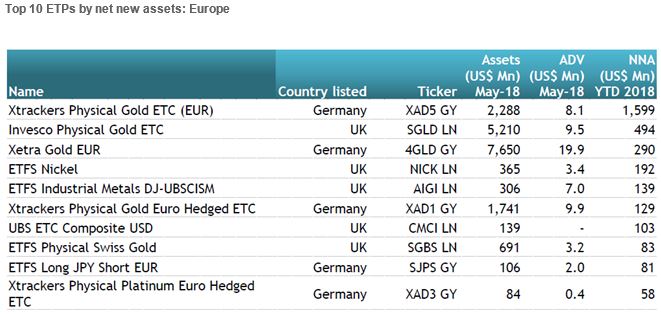
Similarly, the top 10 ETPs by net new assets collectively gathered $3.17 Bn year-to-date during 2018.
During May 2018, Investors’ concerns around current geopolitical risks translated into a reduced appetite for products providing core equity exposure to the Eurozone and Germany.