The term ‘hidden factor’ highlights two perturbing characteristics of the low-volatility anomaly.
The first is that the anomaly goes against common sense, making it counter-intuitive if not actually unacceptable. The second is that the anomaly can easily disappear from data if the data is not properly analysed. Here we address such issues to help relieve investors of some common misunderstandings.
Similar to momentum and unlike other fundamental investment factors, low volatility is based purely on a stock’s price history. Haugen’s low-volatility anomaly states that stocks which have demonstrated low risk in the past, as measured by historical volatility, will not only continue to do so, but they will also achieve roughly the same returns as other stocks.
The risk-return ratio (Sharpe ratio) of low-volatility stocks is therefore not only higher than that of other stocks, but even much higher than that of the higher volatility stocks.
 Etienne Vincent, Head of Global Quantitative Management, THEAM
The risk-return ratio (Sharpe ratio) of low-volatility stocks is therefore not only higher than that of other stocks, but even much higher than that of the higher volatility stocks. This seems to go against the grain: we expect risk to be rewarded with higher returns, just as it can be at the asset class level, and hopefully in life in general. But it’s not: when it comes to investing in stocks, investing in riskier stocks does not seem to compensate you with higher returns.
Of course, measures other than volatility can be used to assess a stock’s risk.
For instance, the beta of the stock measuring its sensitivity to a given benchmark equity market index is also a relevant risk measure. However, beta is not a unique measure of risk since the beta of a stock changes with the benchmark index. Indeed, the beta of a US stock is not the same if measured against the S&P 500 or against the MSCI World index. This is why we do not use beta.
At the portfolio level, minimum variance (or minimum volatility), maximum diversification and equal-risk contribution strategies all eventually rely on the low-volatility anomaly as a source of alpha, even if only as a side-effect of a their construction methodology.
The reasons for the existence of the low-volatility anomaly have been thoroughly researched, and they also contribute to its potentially perturbing aspect, as they are mostly based on cognitive biases from human investors. In short, low-volatility stocks are unpopular and therefore overlooked stocks, and on average one tends to get more positive surprises from stocks of which expectations are low than from more glamorous, ‘in the spotlight’ stocks. In behavioural terms, the preference for the latter can be explained by investor overconfidence, estimation bias and representativeness bias.
Etienne Vincent, Head of Global Quantitative Management, THEAM
The low-volatility factor is also veiled by the way the asset management industry works, as it gives predominance to market capitalisation benchmarks. The mandate of most investors and asset managers is to out-perform the returns to a benchmark index, typically the market capitalisation weighted index of a given country or region. Thus, they are arguably more concerned about their excess returns over the benchmark index and their information ratio than about their absolute returns and their Sharpe ratio.
This contributes to the low-volatility anomaly because when benchmarked against market capitalisation indices, investors and asset managers are actually incentivised to invest in riskier stocks and to avoid the less risky stocks; why buy low-volatility stocks instead of aiming for a higher exposure to the equity risk premium with riskier stocks? The offer and demand imbalanced created in this way is one of the explanations of the low-volatility anomaly that have been put forward by academics.
The implications of the low-volatility anomaly for investors are simple
To summarise: if, over the long-term, investors are compensated with similar returns irrespectively of investing in low-volatility stocks or higher-volatility stocks, then why bother investing in the riskier stocks if no additional compensation is earned for the difference in risk? In all, over the long term it really pays to be prudent in the equity markets.
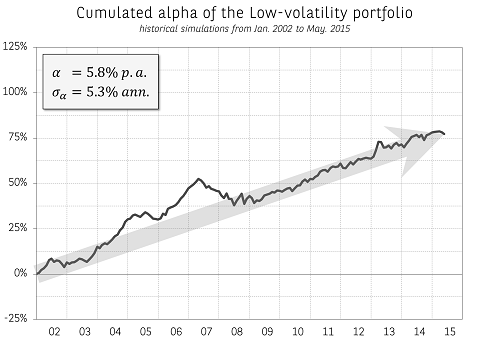
Exhibit 1: Historical simulations of a long-short portfolio based on MSCI World Universe with stocks ranked by a historical low volatility measure

- Source: MSCI, Exshare [divider] [/divider]