
Investors have acknowledged for a long time that markets frequently experience regime changes. Markets do indeed often fluctuate between periods of growth, with low volatility, and periods of panic, with negative returns and extreme volatility. These regime changes are, of course, triggered by economic events (e.g. subprime crisis, debt crisis) or recently public health events (e.g. Covid-19 crisis) and pose a major systemic risk to investment portfolios. So knowing how to identify them makes it possible to protect portfolios against extreme risks and even to take advantage of such events. They also increase our knowledge of the mechanisms underlying regime changes and thus enable us to improve our investment models, putting us in a stronger position to handle subsequent crises. We have thus developed new regime change detection tools based on machine learning techniques, with two objectives in mind: to identify risk on / risk off modes in the market from an absolute return perspective, but also to identify regimes that are favourable to different style factors in equity markets (e.g. momentum, low volatility, growth, value, size) according to a benchmarked approach.
There is a vast amount of academic research addressing the issue of regime changes. An article on market turbulence by Chow, Jacquier, Kritzman and Lowry (1999) determined that such regimes do exist. Ang and Bekaert demonstrated in 2002 that correlations between asset returns tend to increase significantly in highly volatile markets, while diversification within a portfolio becomes less effective. In 1998, Clarke and de Silva showed that a world with more than one regime offers more opportunities for investors who adjust their exposure depending on the market regime.
Machine learning and big data techniques have been developed making it possible to apply sophisticated mathematical models (hidden Markov switching models, which we will examine later) to financial data series in order to identify market regimes. All this has created scope for innovation in the asset management industry.
Machine learning techniques are generally based on statistical or mathematical models and constitute a field of artificial intelligence that can be used to identify and characterise links that may exist within a large data set, whether a conventional data set (time series) or an alternative data set (images, texts, information flows, social network searches, transaction data, geopositioning data, etc.). Machine learning is made up of two parts: a learning component during which the selected model will learn the relationships that exist between different variables, and an application component in which the model will draw on these relationships and solve the problem in question.
The statistical methods used in machine learning can be split into four groups depending on the type of data:
- Supervised learning for labelled data (with information on the data provided);
- Unsupervised learning for raw (unlabelled) data;
- Deep learning, based on replicating a neural network and multi-layer learning;
- A combination of reinforcement, semi-supervised and/or active learning
“Machine Learning is inseparable from Big Data and has four strong points. The approach is geared towards non sample-dependent predictability rather than sample variance estimation. It uses calculation methods that are designed to avoid relying on potentially unrealistic assumptions. It is suited to non-linear, hierarchical, and non-continuous interactions in high dimension spaces. Last of all, it distinguishes between searching for explanatory variables and searching for relationships that may exist between these variables”, explains David Usemma, quantitative analyst in CPR AM’s research team.
Until just a few years ago, machine learning was confined to a few areas of financial analysis such as predicting shortterm movements in market prices, executing trades, and determining credit ratings; but it has since been experimented in a far broader range of fields. “Machine learning could potentially force us to reconsider our preconceived ideas about asset risk premiums and overhaul the way in which our industry operates - from client profiling to asset allocation, from stock picking to risk management”, points out David Usemma. He believes machine learning approaches can be used to generate alpha signals which are useful in stock picking processes, whether based on a series of predetermined factors or on entry signals from existing or recently discovered data.
Machine learning is also increasingly playing a key role in analysing and incorporating ESG data via Natural Language Processing and Topic Modelling, which are used to analyse company reports, press articles and other material to identify a company’s controversies and engagements with respect to climate, environmental, educational and other impacts.
CPR AM uses machine learning to gain a better understanding of market regime shifts and adapt its portfolio strategies in the interests of its investors. “Our aim is to provide a robust tool that will improve visibility for the fund managers in charge of our theme-based and quantitative asset management solutions”, reveals David Usemma.
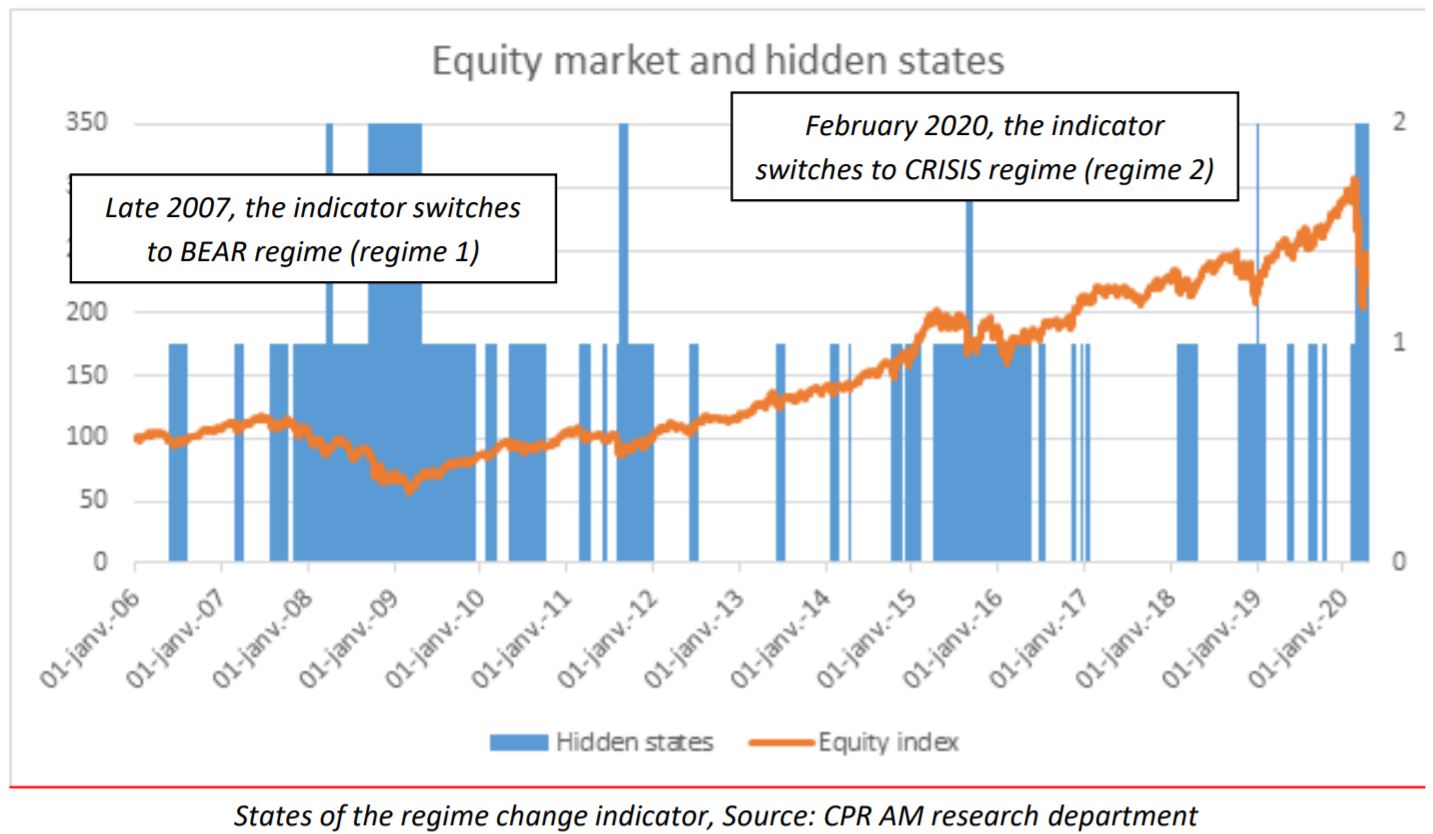
CPR AM’s research team uses hidden Markov models (HMM) to observe market regime changes in time series. This statistical model was developed in the 1960s and has since been applied widely in machine learning to resolve identification problems: voice recognition, handwriting recognition, gene sequence analysis, etc. It was in 1989 that Hamilton suggested using the Markov switching model to detect regime changes in the world of finance. We provide a very simple example here to demonstrate how this model works. Let us imagine someone whose electrocardiogram (ECG) is monitored remotely, with the data being received after a certain time lag. When the person is asleep, we can observe that his average heartbeat is slow with low volatility. When the person is awake, on the other hand, his average heartbeat is faster with high volatility. So, based on these data alone, and without actually seeing the person, we can reasonably assume what state he is in (asleep or awake). The ECG data follow a hidden Markov model and the associated data are displayed at all times depending on the person’s state. When it comes to financial data series, the observations in question may be returns, and the BULL, BEAR and CRISIS regimes will be the hidden states.
Finding the right algorithm is, to some extent, a question of trial and error. Even experienced scientists often struggle to predict whether an algorithm will work before trialling it. Among other factors, the choice of algorithm depends on the size and type of data processed and the information sought. “There are dozens of machine learning algorithms out there. Each follow a different method, and no single algorithm prevails over the others for all types of data. Certain models may seem to work well in sample but then deliver poor results when using out of sample data. So forecast stability is a real challenge!”, explains David Usemma.
After analysing a number of algorithms, CPR AM’s research team selected the Baum-Welch maximum likelihood algorithm (developed by Bilmes in 1998) for the learning phase to identify and characterise market regimes. The trials carried out over the past nine months to detect market regime shifts have proved conclusive.
“We worked on financial data series of equity market returns and credit spreads. The data series went as far back as the mid-1990s for equity markets and the early-2000s for credit markets so that the model could capture previous crisis”, explains David Usemma. With respect to recent events, the equity market regime shifted on 21st February from BULL market (positive return, low volatility) to BEAR market (zero return). It then switched to CRISIS regime in the days that followed (negative return, high volatility).
“The HMM indicator will be used not only to identify bull, bear or crisis market regimes in the equity and credit markets, but also to manage transitions between style factors (e.g. value vs. defensive) in the portfolios of our quantitative investment solutions, such as CPR Equity All Regimes fund. As far as our theme-based fund strategies are concerned, spotting trend reversals will help us protect our funds against the risk of extreme loss”, concludes David Usemma.
Ultimately, machine learning is a remarkable toolbox enabling CPR AM’s teams to reinforce their investment convictions, especially about market regimes, and to innovate by rethinking their investment strategies with novel approaches. Having reviewed regime changes, the next step will undoubtedly be to review factor investing models and incorporate them into our fund management portfolios.
Close collaboration between the research and fund management teams is crucial throughout this process. “A good indicator is one that creates more value than it costs to implement the strategy it has shaped. So when testing different signals, it is necessary to create an environment that closely replicatesthe market by incorporating all the various types of trading costs (broker fees, stock exchange taxes, market effects, liquidity costs) and thus to express the added value created during investable universe back tests, i.e. net of the turnover costs of implementing the strategy. From this perspective, it is often possible to determine the optimal frequency at which different signals should be calculated”, explains Cyrille Collet, head of quantitative equity fund management at CPR AM.