
While the S&P 500 continues to brush up against its all-time highs and valuations remain relatively rich, we consider below the profile of US equity investors in light of the different sources of information that are available.
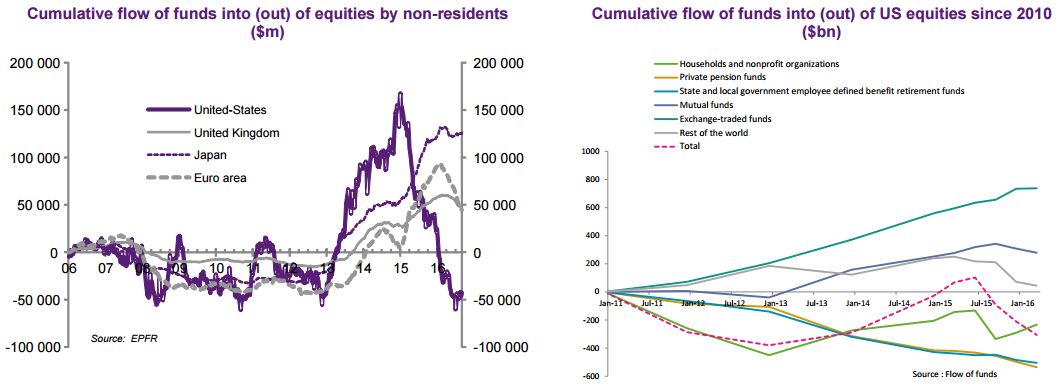
First, note that the excess demand is not emanating from non-resident investors, as they have been net sellers of US equities since the start of 2015 (see left-hand chart below), the EPFR data revealing there have been significant outflows (see left-hand chart below).
According to the Flow of Funds (available up to Q1 2016), there were net outflows from mid-2015 until the end of March 2016 for all US investor
categories (net outflows totalled $330bn for households, pension funds and mutual funds) and for non-resident investors (net outflows of $173m for rest
of the world). Exchange traded funds were the exception (net inflows totalling $100bn over this period).
 The other data that is available reveals that:
- these trends were confirmed over the course of 2016, but that equity purchases by non-resident investors did not decline by as much (Brexit effect) as indicated by the table below; and
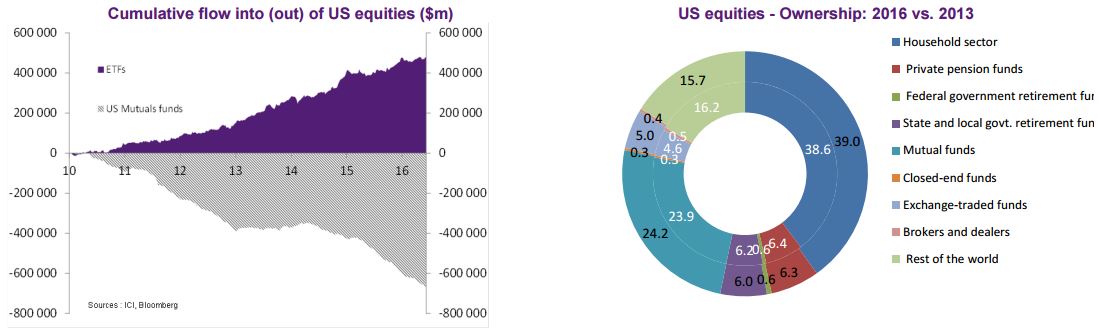
- part of the outflows (by non-resident and domestic investors) is in fact being channelled into ETF, a phenomenon also in evidence in the credit market.

However, the Flow of Funds remains globally on a downtrend (dotted line in the right-hand chart above), while when it comes to the ownership structure for US equities, ETF still occupy a marginal place (5% in 2016).
How can one reconcile the net outflows of funds with the rise of US equity indices? The explanation seems to lie on the supply side: the biggest buyers of US equities have in fact turned out to be the companies themselves... Quarterly Flow of Funds data reveals that net issuance of US equities was negative to the tune of $400bn between 30 June 2015 and 31 March 2016.
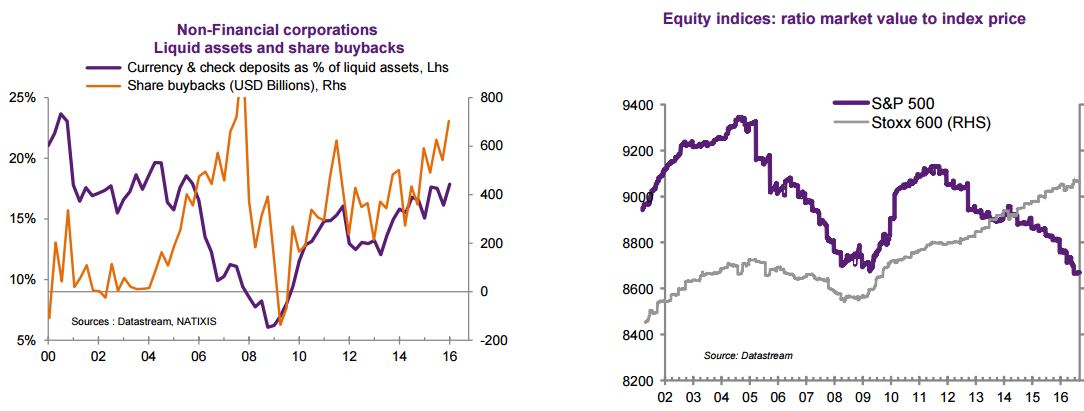
In the US, share buybacks are the main conduit for distributing income to shareholders, mainly for reasons to do with the tax system. Since the start of 2015, what will be observed is that the build up in cash and cash equivalents held by companies has accelerated, while interest rates have held on low (facilitating the financing of share buybacks).
The right-hand chart below shows that this trend was still in evidence in the last few quarters, which should be confirmed by the Flow of Funds (due to be published on 16 September). In Europe, by contrast, no such phenomenon has been observed (dividends are favoured for rewarding shareholders in this geography).
What should we expect going forward? Further share buybacks are less of a given over the short to medium term, as companies are already leveraged to the hilt, and especially since the Federal Reserve is intent on normalising its monetary policy. As supply continues to stabilise, performances by US equities will come to depend increasingly on demand...