It will be recalled that this in-house index seeks to capture investor risk appetite. It is constructed as an aggregate average of key financial variables, expressed in terms of rank by reference to past levels on a 1-year rolling basis. A variable that is at its lowest (highest) over 1 year will be ascribed a rank of 0% (100%) [1].
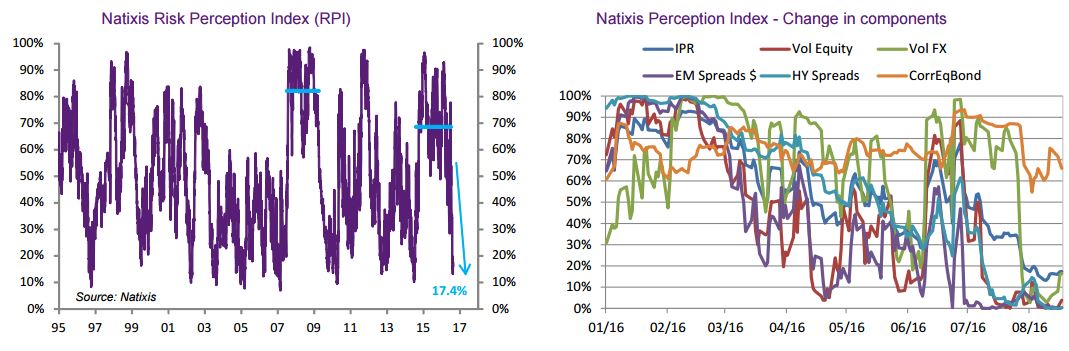
The decline of the Natixis RPI in remarkable in several respects:
- First, it marks the end of the longest period of elevated risk perception observed since 1995, surpassed only during the 2008 crisis: from August 2014 to June 2016, the RPI averaged 69% (vs. 82% between July 2007 and March 2009), as highlighted by the chart below.
- Second, the decline of the RPI has accelerated sharply in the wake of the Brexit shock on 24 June, when the index recorded its second biggest rise on record, soaring by 30pp from 40% to 70%.
As it turns out, the RPI’s sharp decline in July confirmed the downtrend observed since the start of the year for four of the five index components, abstraction made on the Brexit shock at the end of June.
Looking at the detail, the main contributors to the RPI’s decline are: (1) the decline in equity volatility (average 1-month implied volatility for the S&P and EuroStoxx); and (2) the tightening of emerging spreads in US dollar (EMBI+ Composite) and of US corporate high yield spreads (H0A0), reflecting the extent to which investors are reaching out for yield and the rebound in crude oil prices. The FX volatility component (1-month implied volatility) has charted a more erratic course over the year, reflecting uncertainties pre-Brexit, notably as regards the cable. All in all, these four components (volatilities and spreads) are now close to zero. The one “stubborn” component is the correlation between bonds and equities (measured by reference to the US market, as the correlation between the US 10-year TNote and a global equity index), which remains positive, pegged at a high level.
Is the RPI’s decline reason enough to re-channel investments into risky assets?
The chart overleaf displays Sharpe ratios for the main asset classes in light of the different risk regimes. Unsurprisingly, there are very pronounced differences depending on the risk regime. When risk perception is low (i.e. when the RPI is less than 25%), as is the case right now, the best performing assets classes are equities, high yield, emerging assets and industrial metals. When risk perception is high (i.e. RPI exceeds 75%), govies and precious metals are the best performing asset classes. In between, asset classes achieved more or less the same Sharpe ratios.
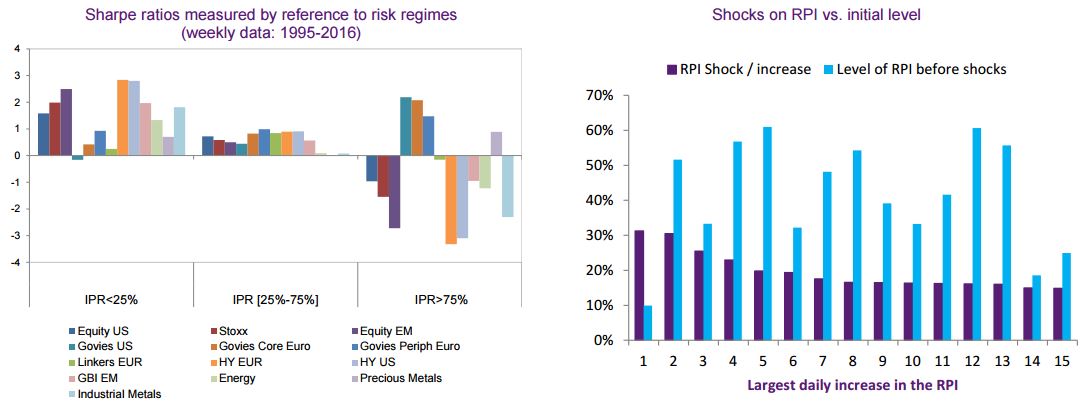
There remains that the RPI is a coincidental risk indicator, not a forward looking risk indicator. Past experience shows that a low RPI does not necessarily point to strong risk aversion shocks (see chart below). At the same time, the very low level of the RPI does not appear sustainable over the medium term given the many uncertainties that await after the summer break, notably an expected re-pricing of the Federal Reserve’s monetary tightening (our expectations being for a hike in the Fed Funds rate in December) along with a resurgence of the political risk in Europe (Italian referendum) and in the US (presidential election).
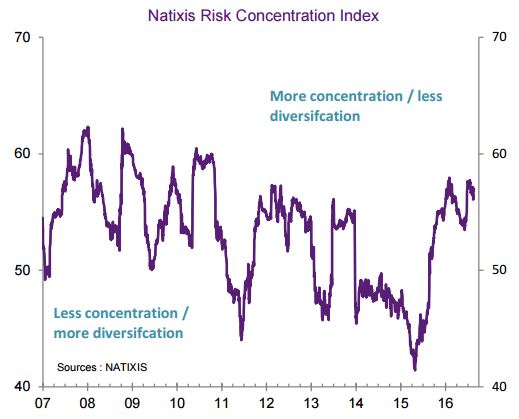
Bearing in mind also the currently very aggressive equity positioning of hedge funds and given that the risk concentration index has held on high in recent weeks (see below), our view is that the recent decline in the risk perception index should be interpreted with caution, not with complacency.