
As one of the world’s largest economies the US is a key focus for investors. With every country attempting to return to normality following the coronavirus pandemic, we are monitoring when US economic activity might get back on track, as well as other measures of “normality” such as entertainment and leisure, high street shopping, and schools reopening. The result is an index that measures progress toward a post-pandemic world.
Our Return to Normal index
As the US continues its Covid-19 vaccination program, the Return to Normal Index measures human activity data relative to pre-pandemic levels. The index is constructed by our data scientists and fundamental analysts and tracks activities in the US, including travel, returning to work and school, brick-and-mortar shopping and eating out. By design, the index is focused on measuring components of daily life rather than economic indicators such as GDP growth. The percentage level will move closer to 100 as daily life normalises, and our analysts will update it on a regular basis.
What has changed?
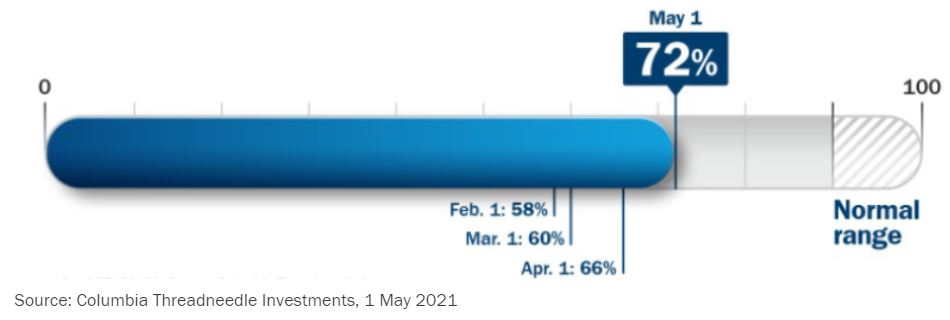
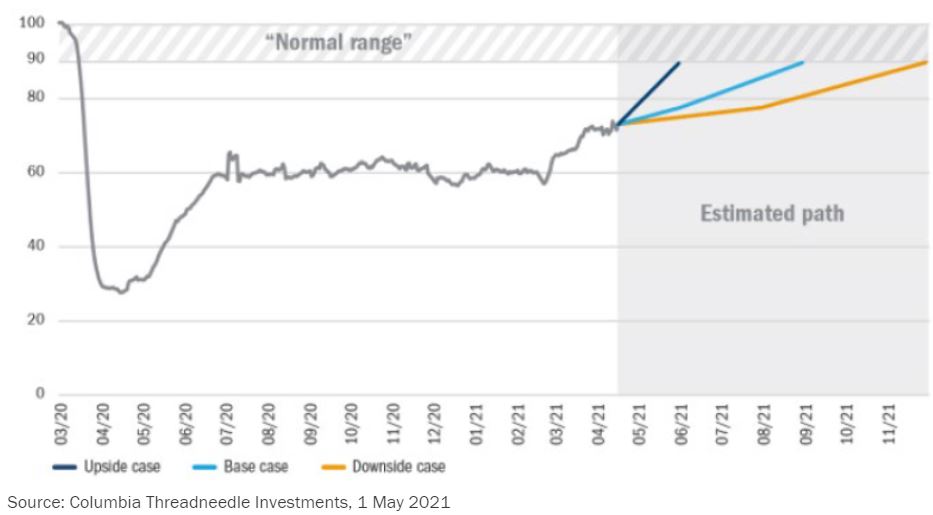
Since our April update, the Return to Normal Index has climbed further, to 72%, fuelled by gains in travel, entertainment and a return to in-person schooling. Now that immunity levels are increasing – through a combination of vaccinations and prior infections – we expect to see a continued decline in active cases over the next couple of weeks. As a base case scenario, we expect the index to advance over the month of May as greater immunity and seasonal factors push activity levels higher. If there are no significant setbacks, the US could reach the normal range by August. We are continuing to watch the data on variants in the US, and if we see a large spike in cases, the momentum carrying the country to our normal range could slow.
Activity numbers won’t all return to where they were before Covid. The index could hit “normal” at a point lower than the 100 level due to continued changes in behaviour, like working from home and reduced business travel. The definition of the future normal is evolving, and the index’s normal threshold will reflect our data science and fundamental research insights.
Figure 1: The Return to Normal Index tracks activity compared with pre-pandemic levels as we progress to post-Covid life
What are we monitoring, and where is it at?
We are analysing the time people spend engaging in a broad set of activities outside their homes (Figure 2). The index components have implications for economic growth, but the primary objective is to monitor how close or far we are to returning to normal life.
Figure 2: Tracking inputs
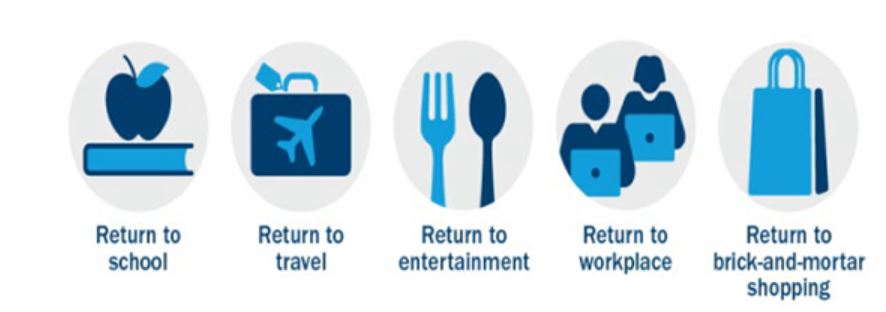
Our index suggests we are still 28% below pre-Covid activity levels. The levels of component activity vary: the return to brick-and-mortar stores is 18% below its pre-Covid level and a normal work routine is 23% below. The subcomponent with the lowest level is travel/entertainment: 43% below pre-Covid levels.
What could drive change?
Faster vaccine distribution and uptake could accelerate the path to normal (ie, the upside case). Developments that could impede a return to normal (ie, the downside case) include the emergence of variants that are resistant to current vaccines or slower uptake of the vaccine in certain places (because of people’s unwillingness to get vaccinated or shortfalls in supply).
Figure 3: The Return to Normal Index over time – level as of 1 April 2021: 66%
This index provides a framework as we analyse companies. It is a roadmap for what normal activity might look like after Covid and how long it will take to get there. The information allows us to test a company’s own assumptions and make adjustments in our views as needed.
For investors, the Columbia Threadneedle Return to Normal Index can act the same way: it’s an additional input to consider as they research their individual asset allocation and portfolio decisions.
Understanding where we are on the path to normal life will be a critical question in 2021. This data can help inform investors’ asset allocation decisions and set expectations on market activity.